 Automated
Visual Inspection
PlanningAutomated
Visual Inspection
Planning
Automated
Visual Inspection
PlanningAutomated
Visual Inspection
PlanningThis research proposes a fully automated and flexible visual inspection planning framework that allows for the efficient determination of camera poses in order to inspect an object effectively. It is achieved by finding optimal poses that satisfy the sensor constraints and that optimize a specified objective function. The framework is flexible enough to plan using a variety of optimization criteria. In this research, the framework is used to find stereo camera poses that minimize the mean square error of the 3D length of an object's edge due to localization error. Other optimization functions that work for a single camera are also discussed. In particular, an optimal pose is such that the probability that the error is within a specified tolerance is greater than a required threshold for all the entities of interest. The planning takes into account the sensor constraints and uses a modified version of the Entity Aspect Graph algorithm to define visibility regions and the Sensor Constraint Graph as the core of the planning framework. Several experiments using real data are performed to evaluate the proposed framework.
 |
Fig.1. This research deals with the dimensional inspection of the edges of polyhedral objects using a stereo camera as the sensor
Fig. 2 shows the architecture of the system. The system is designed so that the user is able to specify the objective function to optimize, the sensor constraints to consider, the inspection strategy, the optimization algorithms, among other things.
 |
Fig. 2. Components of the planning architecture
Fig 3. illustrates the flowchart of the system. The input to the system is a boundary representation of the object, a set of the entities of interest, the camera parameters, and a tolerance requirement plus a threshold for the acceptance of the camera pose.
 |
Fig. 3. Flowchart of the automated visual inspection planning system
The first stage of the planning is the generation of visibility regions where the entities of interest are observable. First, an aspect graph is generated. Second, the graph is contracted using an entity-based aspect graph (EAG). The EAG only keeps the viewing regions were the entities of a subset of entities of interest are completely visible. Each node in the EAG represents a viewing region and the sets of entities that are observable, adjacent nodes represent adjacent viewing regions. The EAG is then input to the planning procedure.
A sensor constraint graph (SCG) is constructed from the EAG by augmenting the EAG nodes with information about the sensor constraints, tolerance requirements, and objective function to be minimized. The processing of the SCG will result in a settings list (SLIST), which is a candidate list of optimal poses that satisfy the tolerance requirements. In order to find a candidate pose, a nonlinear program is solved for each node in the SCG graph. After performing the optimization, if all the entities of interest in the SCG node satisfy the tolerance requirements, the optimal pose is kept in the SLIST. On the other hand, if there are some entities that do not satisfy the tolerance requirements, then the node is split into new nodes that can be optimized separately. When all nodes have been processed, the SLIST is input to the sensor selection routine that selects the set of cameras that can be used for the final planning.
AG-EAG GUI interfaces with other programs to view the model of object under inspecting; to generate and view the Aspect Graph; and to generate and view the Entity-based Aspect Graph . Move the mouse over the picture to see more information.
Fig. 4. AG EAG GUI
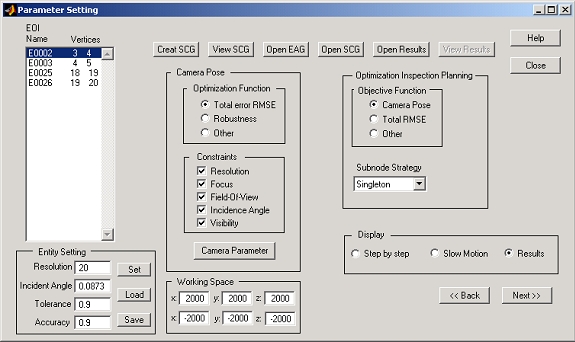
Settings GUI interfaces with other programs to generate and view the Sensor Constraints Graph; to set the camera parameters, to set the inspection accuracy and tolerance, and to set the planning criteria. Move the mouse over the picture to see more information.
|
Fig. 5. Setting GUI
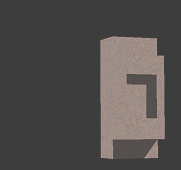
POVRAY is used to render the images that simulate the object captured by the camera at a particular position and orientation.
 |
 |
|
image simulated for left camera
|
image simulated for right camera
|
Fig. 6. Simulated Images corresponding to the object has one pocket and two steps features.
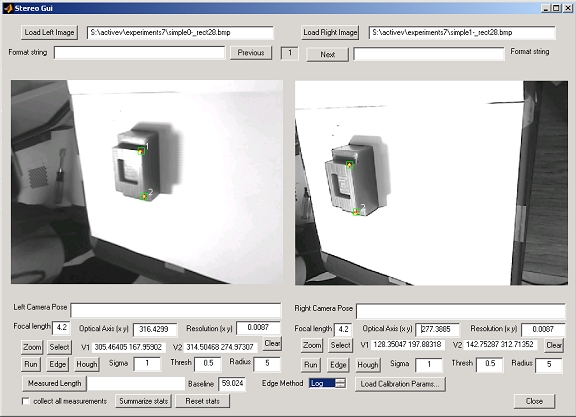
Fig. 7. Inspection Tool
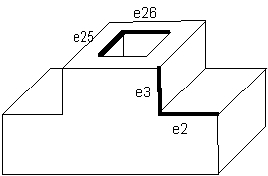
In this experiment, a plan that minimizes the total number of sensor poses is generated. The object p2s.00 was used for this experiment. The planning requirements are listed in Table 1 below. An illustration of the entities of interest in the p2s.00 object is shown in Fig. 8.
Table 1. Planning Specifications
| Accuracy | 90 |
| Threshold | 0.9 |
| Localization Error Variance | 6 |
| Entities of Interest | e2 e3 e25 e26 |
| True Length | 12 12 25 27 |
![]()
![]()
Fig. 8. Entities of interest for the p2s.00 object (in bold)
The plan generated by minimizing the total number of sensor poses resulted in three poses. In order to minimize the number of poses, the plan was able to find a pose that can observe two entities simultaneously. The probability that the measurements of the entities are within the tolerance requirements is shown in Fig. 10. In that plot, we can see that the probability is greater than the required probability of 90% for each of the entities. The final settings are given in Table 2, respectively. Fig. 9 shows a Virtual Reality Modelling Language (VRML) illustration of the sensor poses with respect to the object.
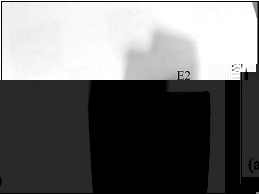
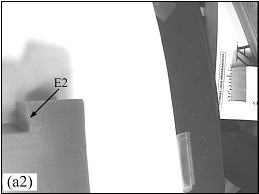
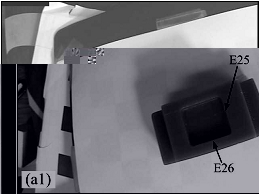
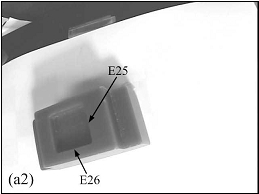
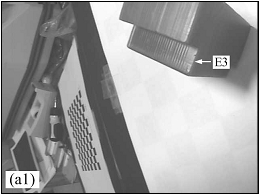
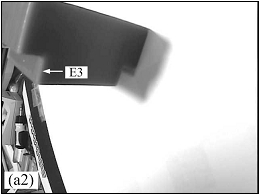
The plan executed to verify the feasibility of the sensor poses. Fig. 10 shows how the pictures from the three settings using a real sensor look like.
Table 2. Final Settings that minimize the total number of camera poses
| Setting | Pose | EOI |
| s1 | 81.46 -31.93 74.40 1.51 -0.70 -3.07 | e2 |
| s2 | 22.99 55.50 145.29 -0.23 -0.29 2.88 | e25 e26 |
| s3 | 138.12 -38.61 9.52 0.85 -0.53 -1.20 | e3 |

![]()
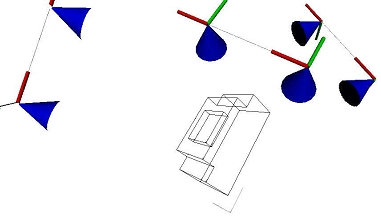
Fig. 9. A VRML illustration of the placement of the planned sensors for the entities of interest of the p2s object. Each stereo camera is represented by a pair of cones. From left to right, the sensor setting are s3, s1, and s2.
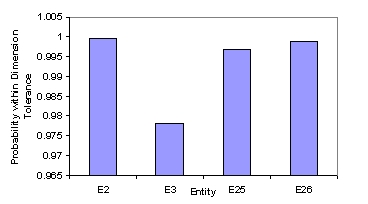 |
Fig. 10. Probability that dimensional measurements are within 90% accuracy for each of the geometric entities for the p2s.00 object. The probability for each entity is greater than the required threshold of 0.9.
 |
 |
|
left image s1
|
right image s1
|
 |
 |
|
left image s2
|
right image s2
|
 |
 |
|
left image s3
|
right image s3
|
Fig. 11. Stereo images captured from the sensor settings determined by the inspection plan that minimizes the total number of sensor poses for the p2s object